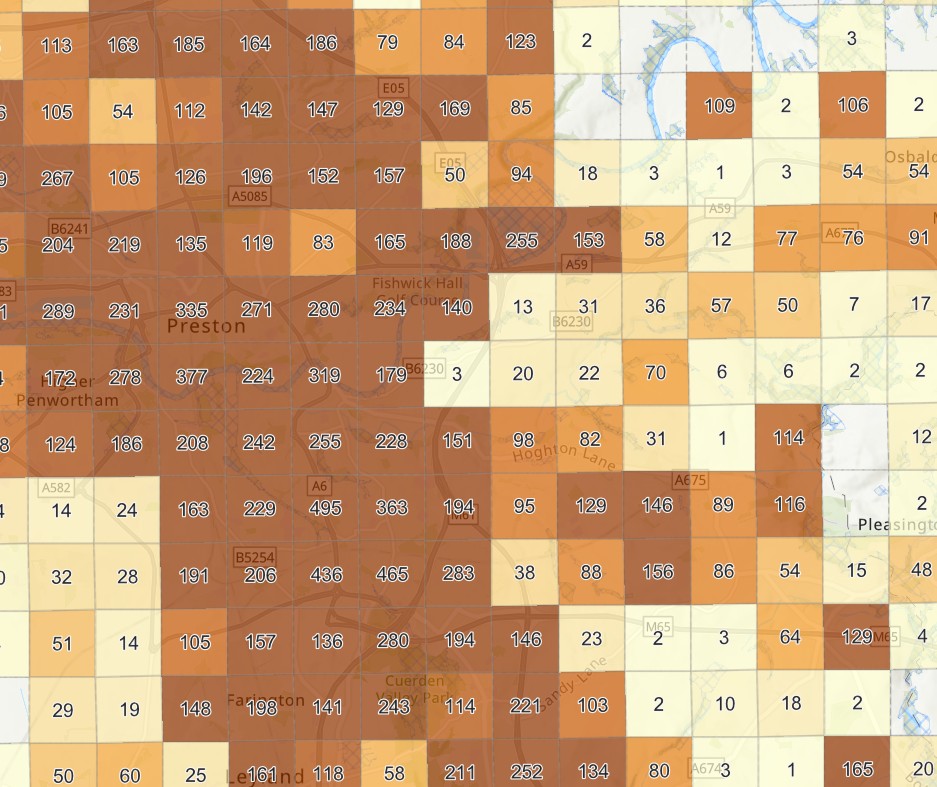
Earlier this year i was asked to produce an interactive map to support the production of the next ‘Plant Atlas’ for Greater Lancashire. The next Atlas will cover the period 2020 to (probably, 2030). This Atlas will map species at monad scale (1km grid) across vc59, vc60 and parts of old Yorkshire vice-counties now falling into the Greater Lancashire administrative area.
Atlas maps such as this are essential to building up information on species trends, for example losses and gains, and can provide us with warnings about pressures to particular species that may need targeted conservation action.
Understanding species distribution can also tell us more about our natural environment, it’s status, the condition of habitat and hint at wider fundamental changes such as subtle changes to land use, increasing nutrients, and changes to the climate.
It is simple to contribute to the new Atlas and we are keen that every species is represented, from regional rarities to the humble Nettle. Anyone can take part; simply upload observations of plants to a linked recording system (ideally iRecord).
If you’d like to target your impact then check out the interactive map below. The numbers indicate the number of plant species reported within each 1km square since 2020. Find empty or low numbers and head there first!


 using WordPress and
No responses yet