Playing with Prediction
Over the course of last Autumn i was part of a team fortunate enough to receive a Natural England commissioned project to investigate the application of predictive modelling on CHEGD species in Lancashire.
We set up an iNaturalist recording project and began collating CHEGD species data, historical and recent, from across the County and from a wide range of sources. These data then fed into a spatial modelling technique known as Maximum Entropy (‘MaxEnt’ for short) which we applied using the ArcGIS Pro ‘Presence-only Prediction’ tool.
In addition to the species data the tool requires meaningful environmental variables to be used as predictors. The predictors needed to be ecological meaningful to the species being modelled and have a coverage across the county. We selected a range of geophysical, climate, land use and biological predictors including (among others), altitude, slope, substrate, habitat and agricultural grade.
We then processed the species data and ran the tool against these variables. The tool identified coincidence and the strength of any relationship for the known species locations and extrapolated that across the whole of the combined predictor dataset coverage (in our case Lancashire County).
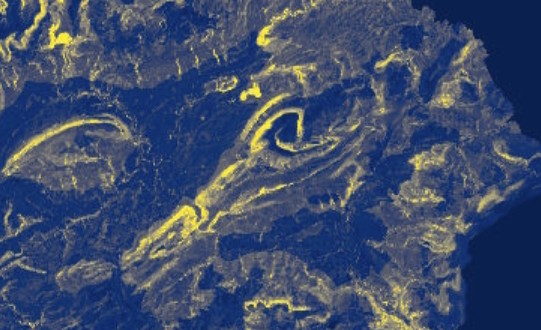
This was repeated for each of the species we had enough data for with Species Distribution Models (SDM’s) produced for each. Then, following recent work by the UK Centre for Ecology and Hydrology, we combined all of the species, Red Data List species and ‘High Diversity’ Indicator species to produce combined predicted richness maps for the County.
This should allow us to now predict areas which are likely to support a high richness of species even where we do not have species occurrence data. There are a range of potential uses for this including the development of alert maps for planning and tree planting, the targeting of field survey to identify important sites and for helping to direct further research and conservation management into these important species assemblages.
Clearly it doesn’t quite end here and this is just a first stab at predicting the location of high richness areas based on limited field survey and with no testing of the outputs beyond the internal tests carried out by the tool.
There are significant known limitations in terms of the species data and the predictor variables. Survey data is enormously bias towards accessible and expected locations of the species and there are issues around the relevance of habitat classes to the ecological requirements of CHEGD species which are likely to be influenced much more by management than the habitat (type of grassland) itself.
However, the work has identified a pathway to improving our knowledge of these assemblages in Lancashire. We can now test the model by visiting high and low predicted locations and carrying our further field survey. We also now recognise and can demonstrate the importance of detailed habitat information, condition data and the importance of capturing land management in a standardised way.
Hopefully, the increased awareness and recording of CHEGD species and their importance and help to refine the way we collect land use data in the future in turn allowing us to better refine the method and ultimately the mapped outputs.

 using WordPress and
Comments are closed